For richer, for poorer… inequality curves now look similar in the UK and rural Africa
22nd January 2014

Idly scanning the pages of the Observer on Sunday morning, this graphic caught my eye in Will Hutton’s article about inequality in Britain.
")
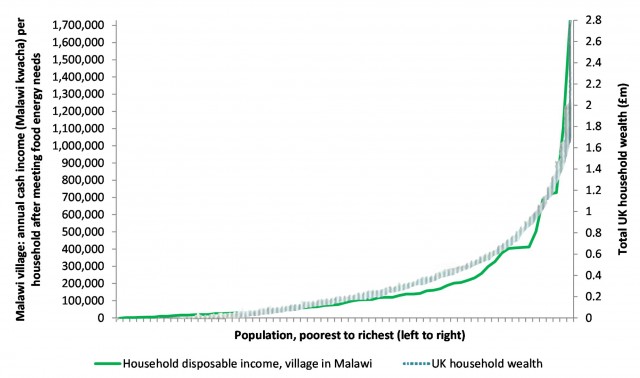
UK wealth distribution chart published in the Observer (19th January paper edition); not available online.
Evidence for Development has a large collection of individual household income data from some of the poorest countries in Africa, and Hutton’s chart on wealth inequality in the UK reminded me of our disposable income data from villages in Malawi and other similarly impoverished countries:
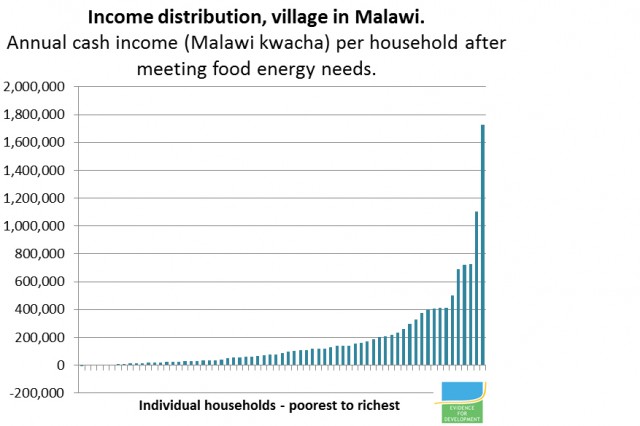
Source: Evidence for Development
So what does it mean to be at the bottom end of the income distribution in the world’s 6th largest economy compared with one of its smallest? Beyond public services and some material goods, for most of the time it’s more or less the same: living from day to day, poor nutrition, skipping meals to feed your children, badly-paid work, poor health and low life expectancy.
Inequality matters – as Hutton says, it’s inequality that is behind poverty. And while the ‘rich’ at the top end of the income curve in a Malawi village can hardly be compared with the mega rich in the UK, the experience at the bottom end is chillingly, universally ‘equal’.
Categories: Data, IHM, Inequality, Malawi, Poverty research, UK
Comments
No comments yet.
The comments are closed.